
Year 11 Nonlinear Graphs Worksheets (GCSE) | Printable PDFs
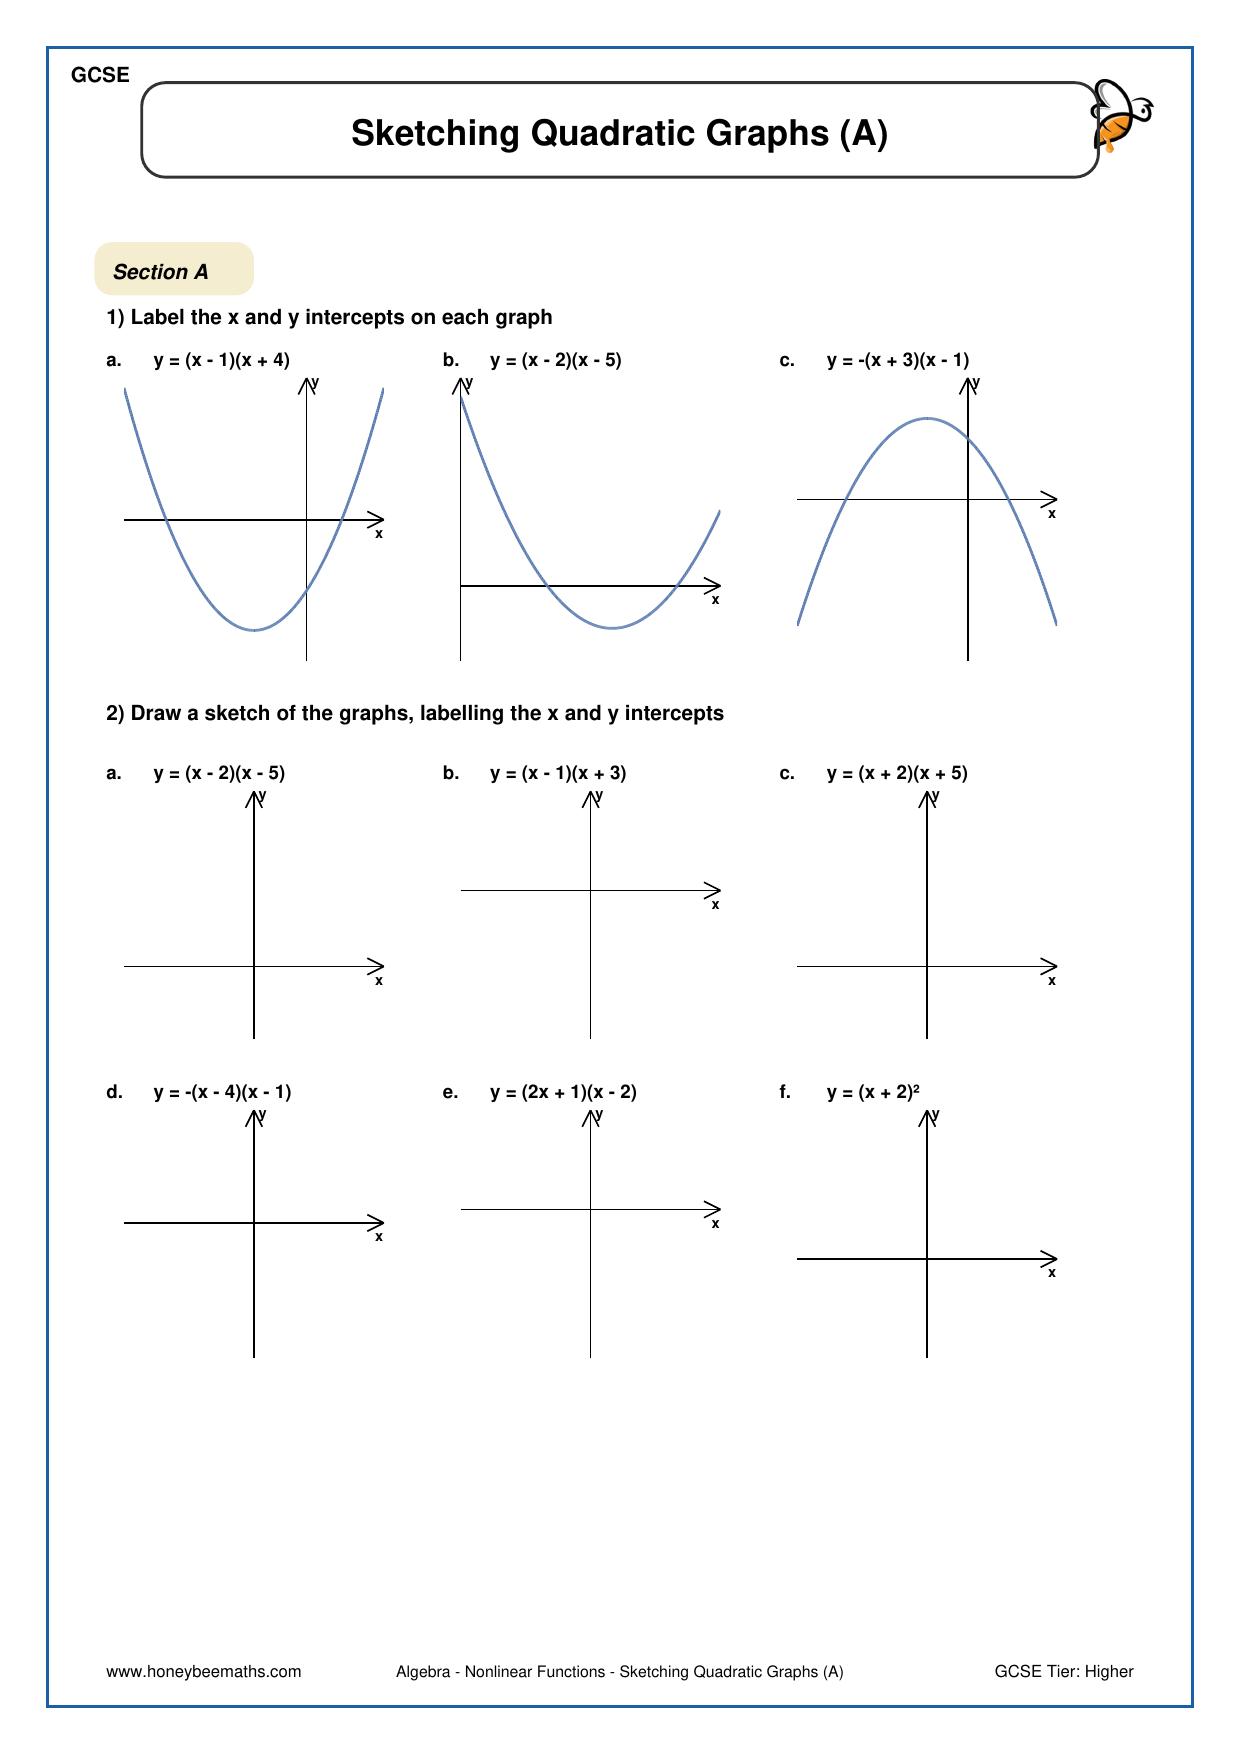
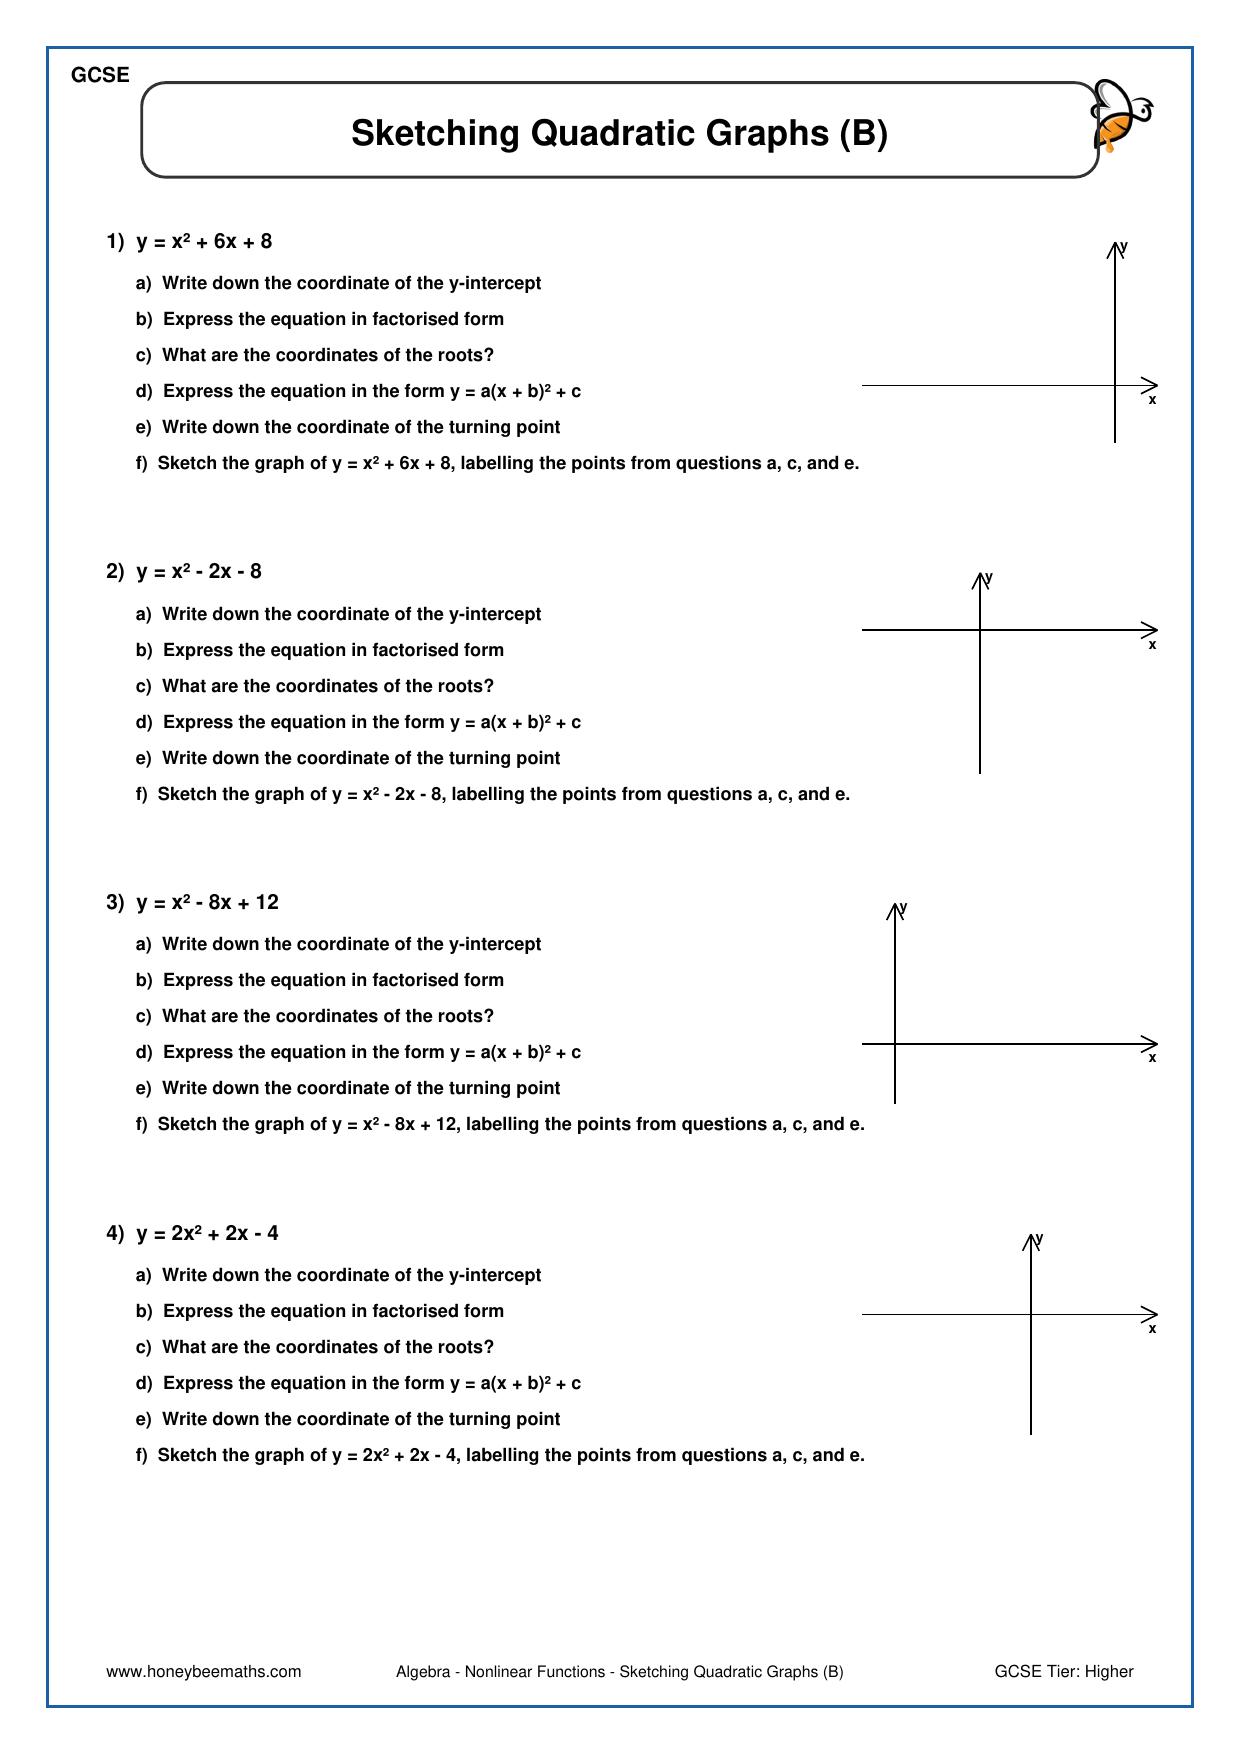
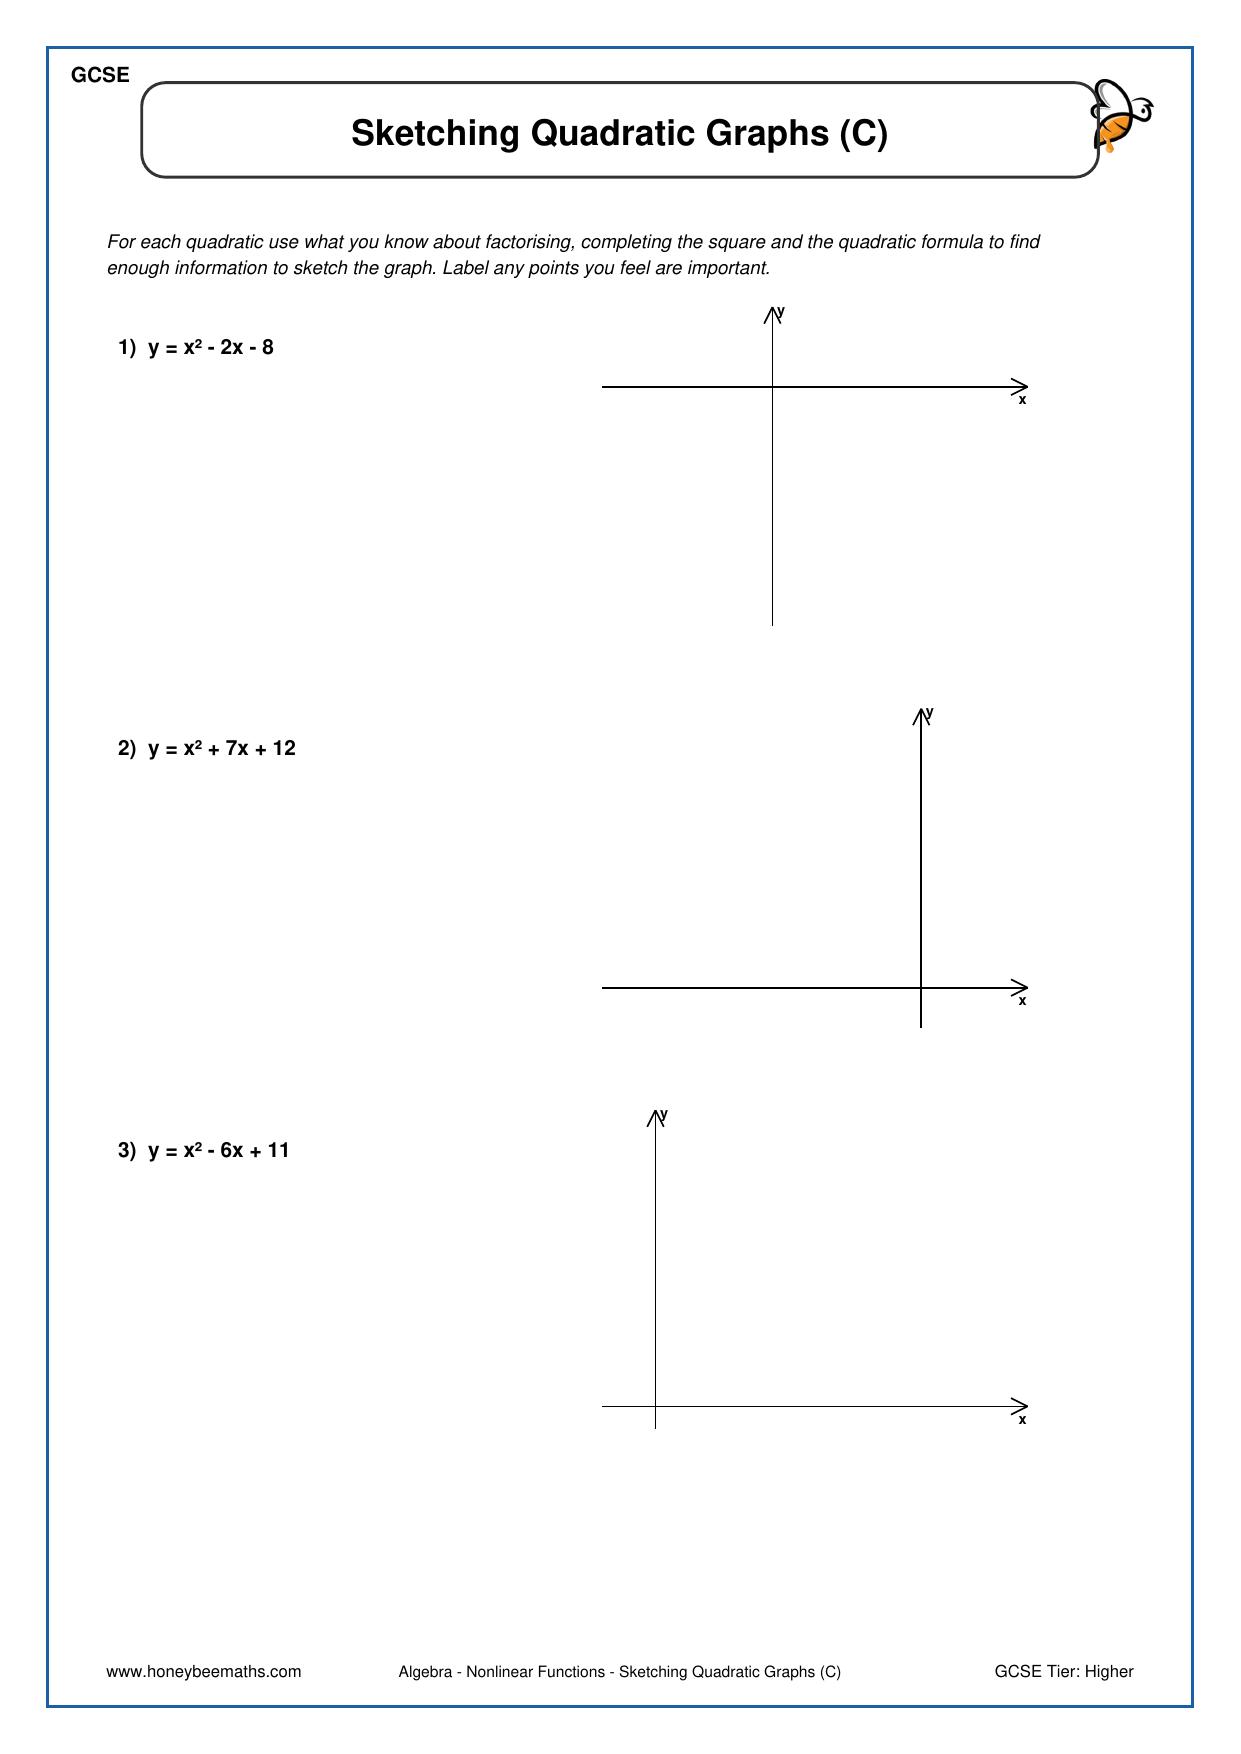
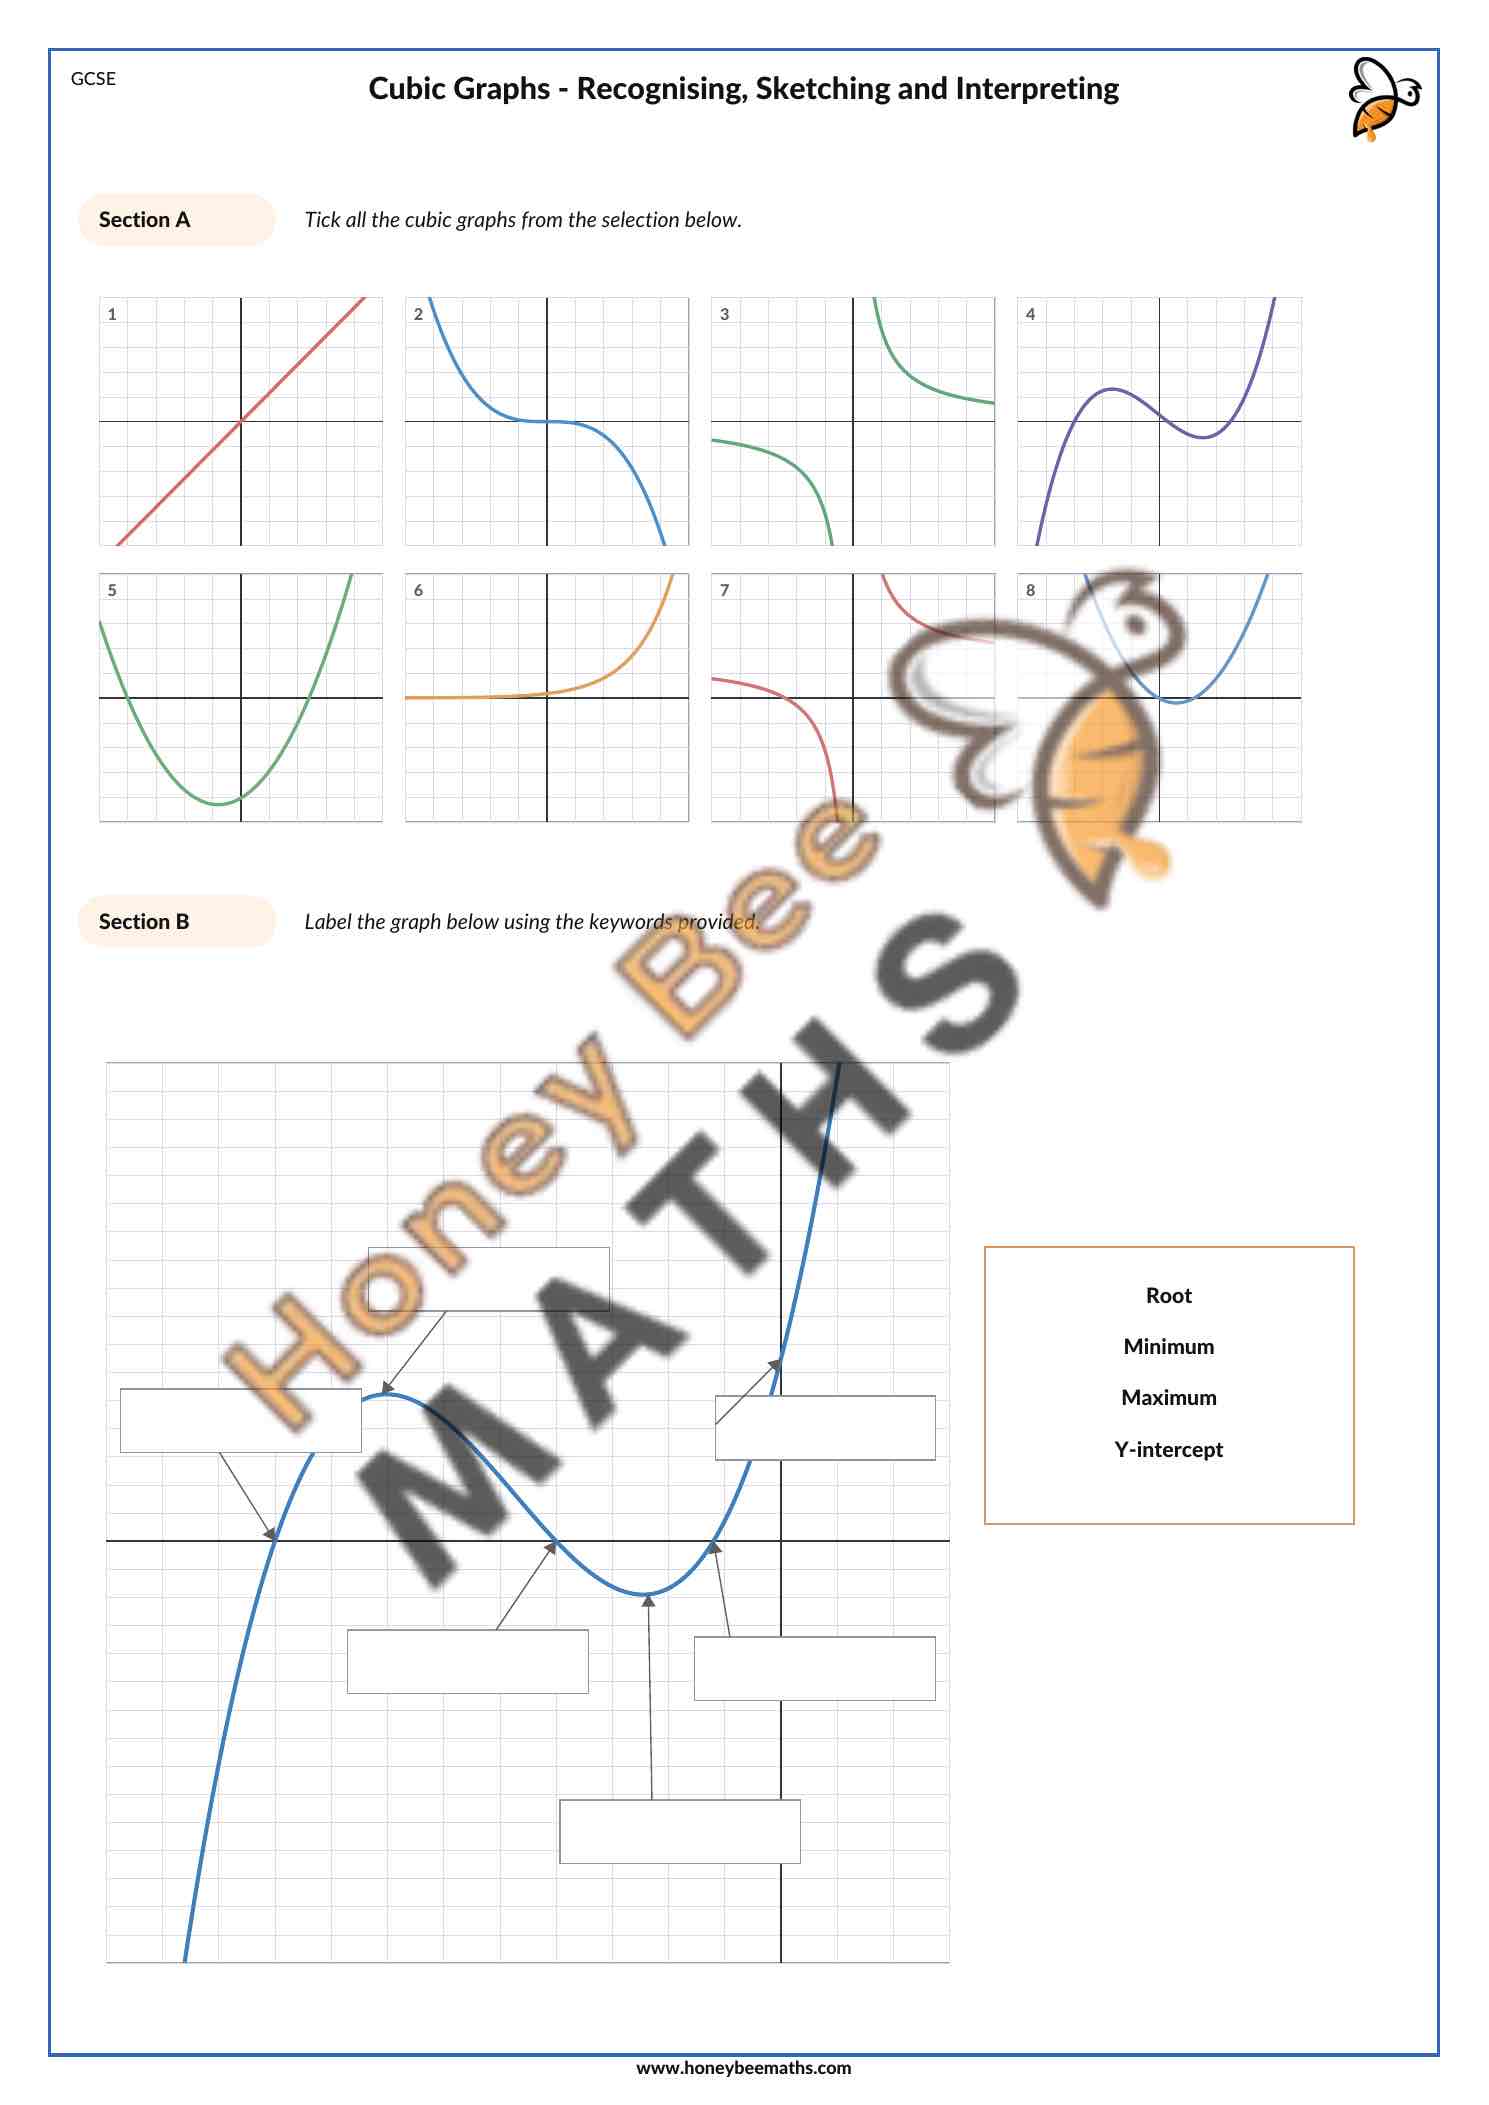
In Year 11, nonlinear graphs are graphs that do not form a straight line. Common examples include quadratic graphs, cubic graphs, reciprocal graphs and exponential graphs. You should be able to recognise these graphs from their characteristic shapes and understand how changes to an equation affect the graph. For example, a quadratic function such as y = x² produces a curved, U-shaped graph called a parabola, while cubic functions can produce an S-shaped curve.
Questions on nonlinear graphs often require you to complete a table of values, plot coordinates accurately and join the points with a smooth curve. You may also need to use a graph to estimate solutions to equations, find roots or identify points where two graphs intersect. When sketching or interpreting nonlinear graphs, pay close attention to important features such as turning points, intercepts and the overall shape of the graph.
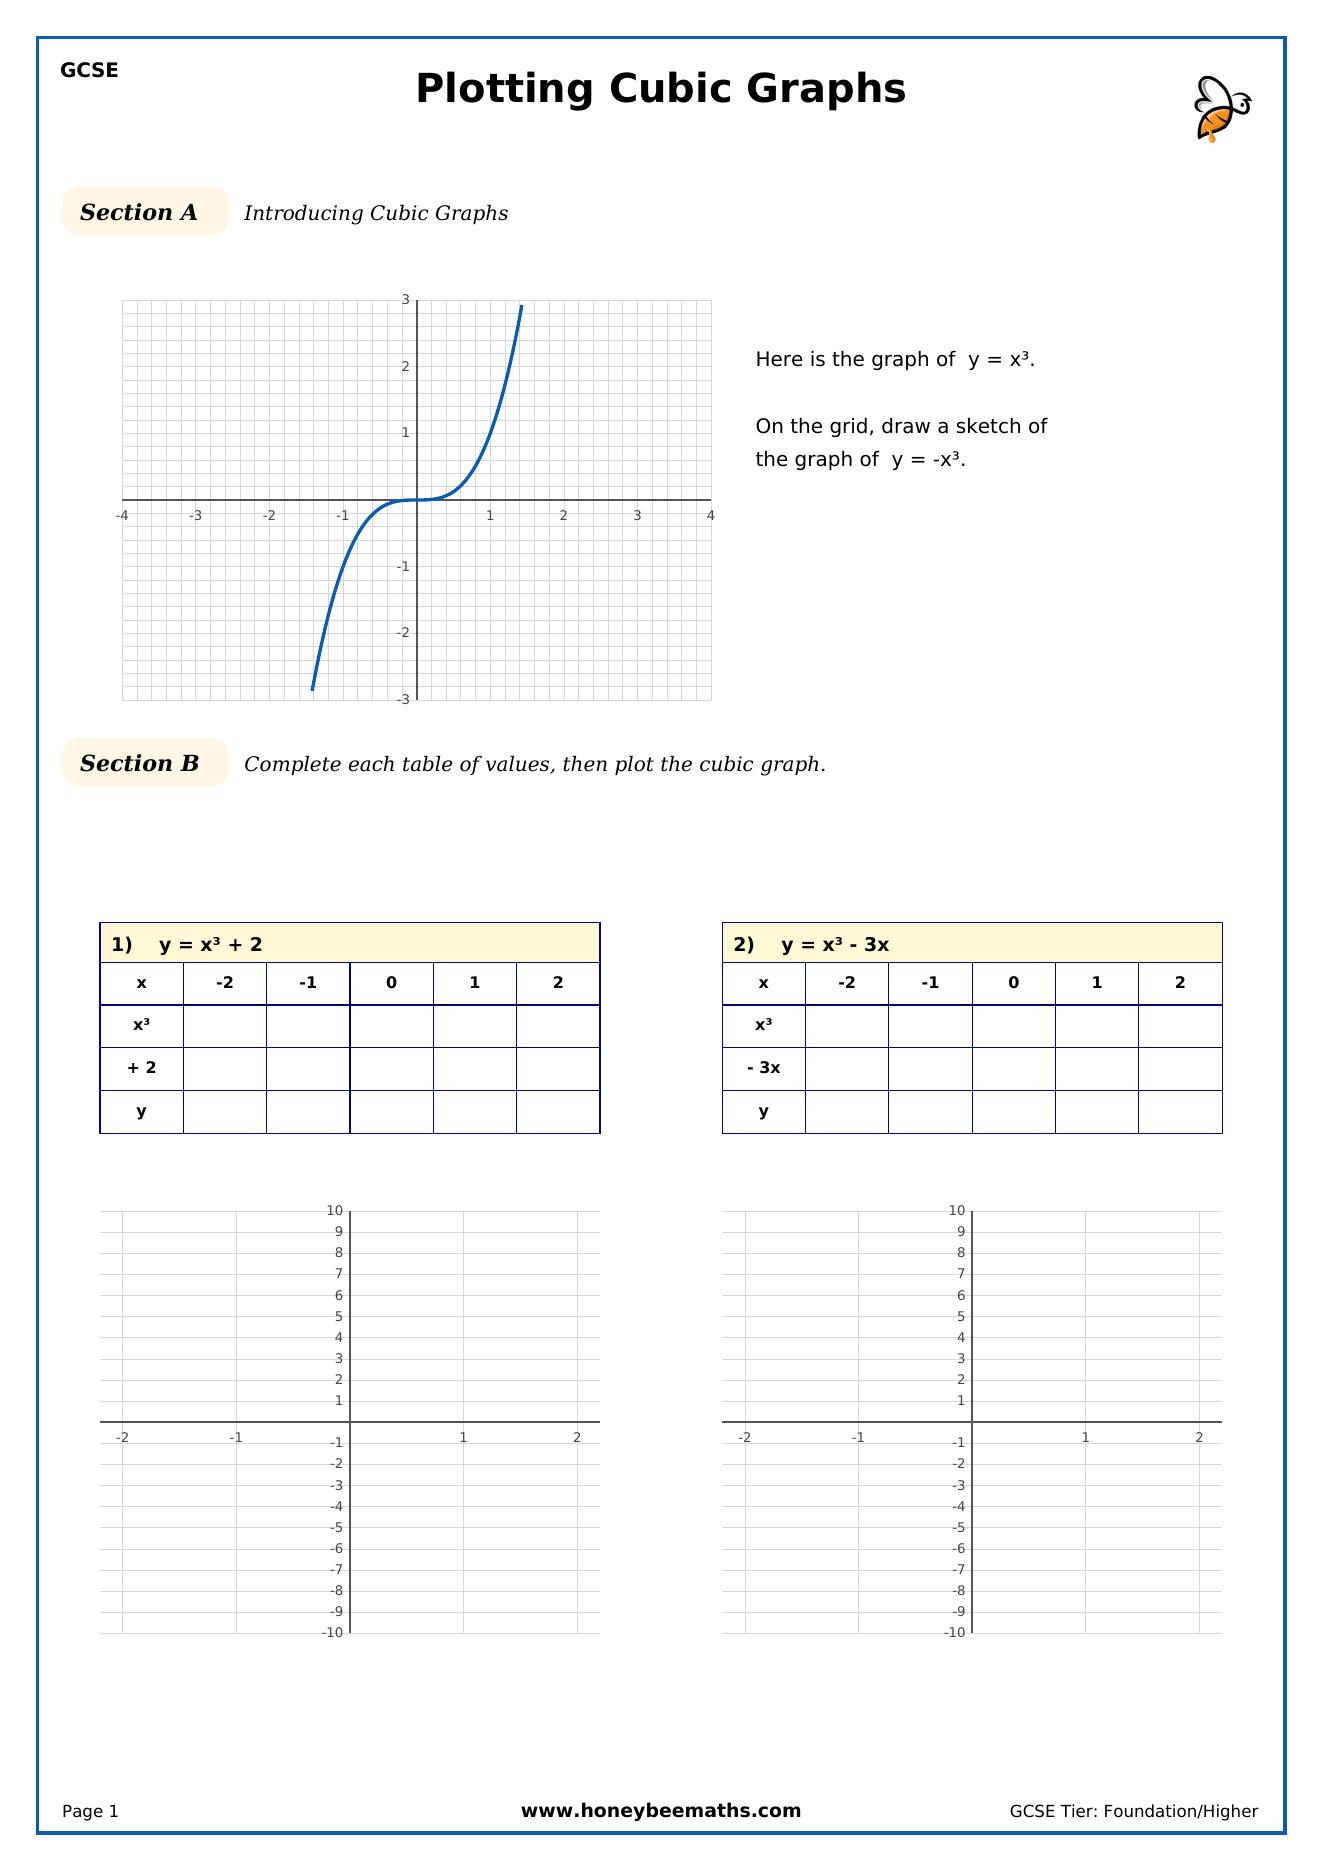
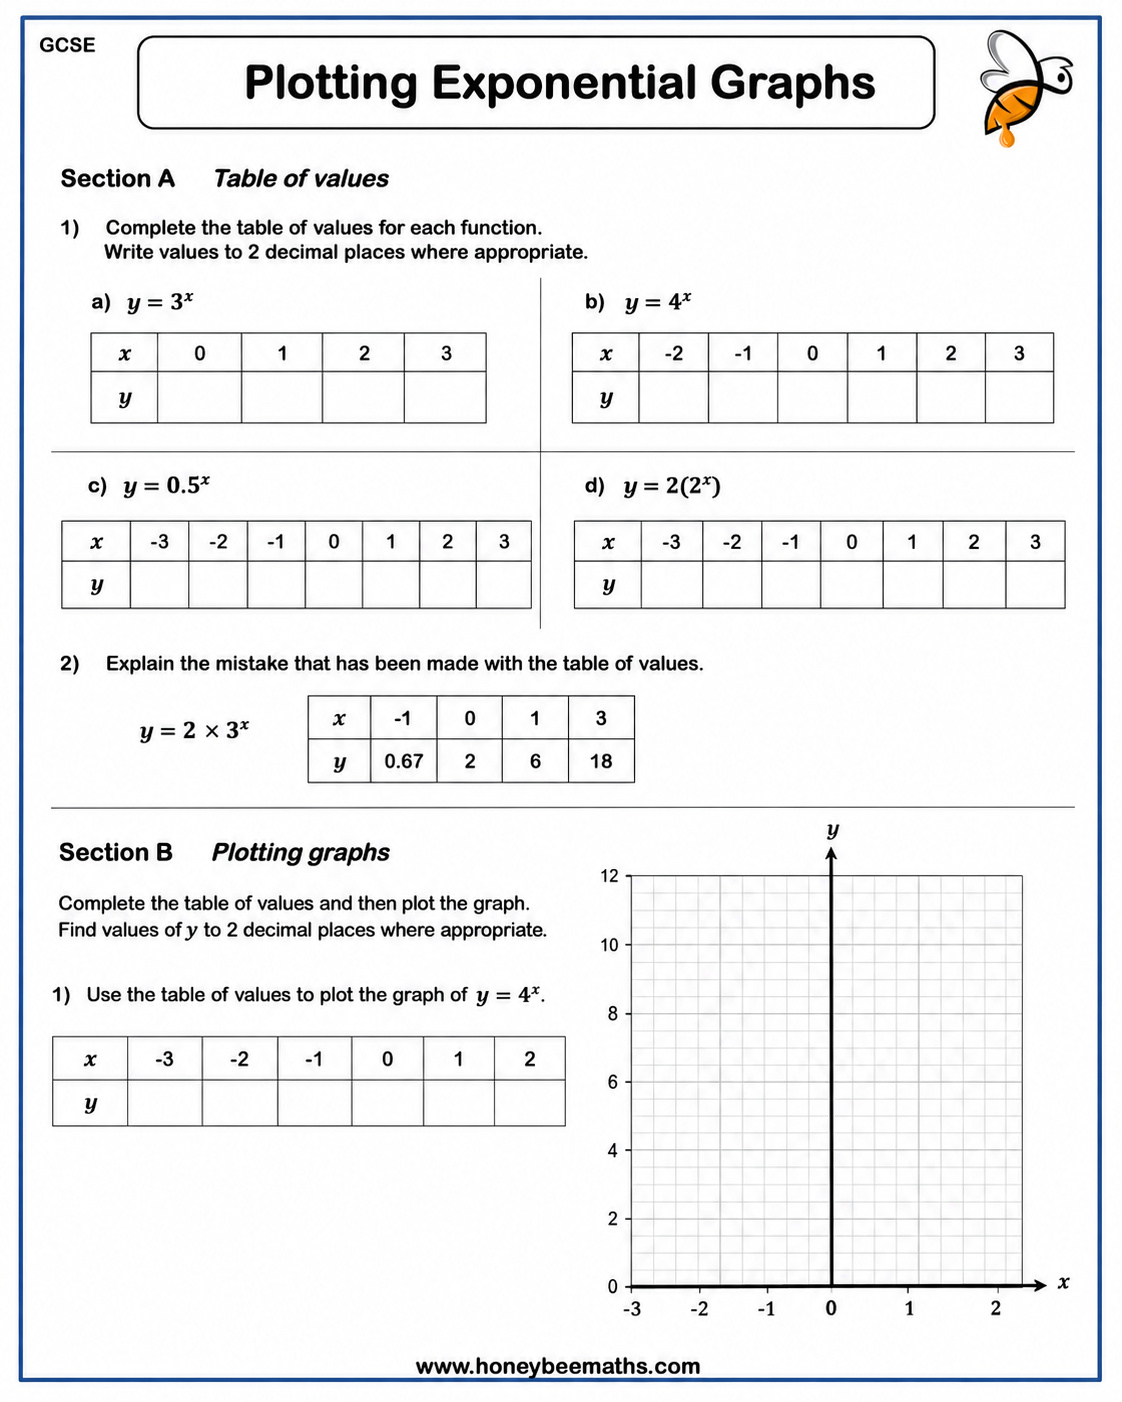
Exponential Graphs
Trigonometric Graphs


For more Nonlinear Graphs Worksheets, see Year 10 Nonlinear Graphs Worksheets
Common Questions about Year 11 Nonlinear Graphs
What is a nonlinear graph?
A nonlinear graph is a graph that does not form a straight line. Its gradient changes as you move along the curve.What are some common types of nonlinear graphs?
Common nonlinear graphs include quadratic graphs, cubic graphs, reciprocal graphs and exponential graphs. Each has its own distinct shape and features.How do you plot a nonlinear graph?
Choose suitable x-values, substitute them into the equation to complete a table of values, plot the coordinates accurately and join them with a smooth curve.
Year 11 Nonlinear Graphs Common Mistakes
Common Mistake 1
Students sometimes join the points with straight line segments instead of drawing a smooth curve. Most nonlinear graphs should be sketched as continuous curves.Common Mistake 2
Students often make errors when substituting negative values into the equation, especially when squaring or working with fractions.Common Mistake 3
Students may forget to identify key features such as roots, intercepts, turning points or asymptotes, which are important when interpreting nonlinear graphs.
Nonlinear Graphs Worksheets - Free Worksheets Above

Solving Trigonometric Equations

Area of Triangles

3D Trigonometry and Pythagoras (A)