
Year 9 Probability Worksheets | Printable PDFs
Year 9 Probability worksheets for Year 9 Maths (Key Stage 3). Students aged 13–14 learn how to calculate probabilities and understand the likelihood of events occurring. For probability basics go to Year 8 Probability Worksheets.
Students practise using relative frequency, sample space diagrams and tree diagrams to solve probability problems. Probability space diagrams show all possible outcomes of an event in a table or grid. A tree diagram shows all possible outcomes of successive events using branches.


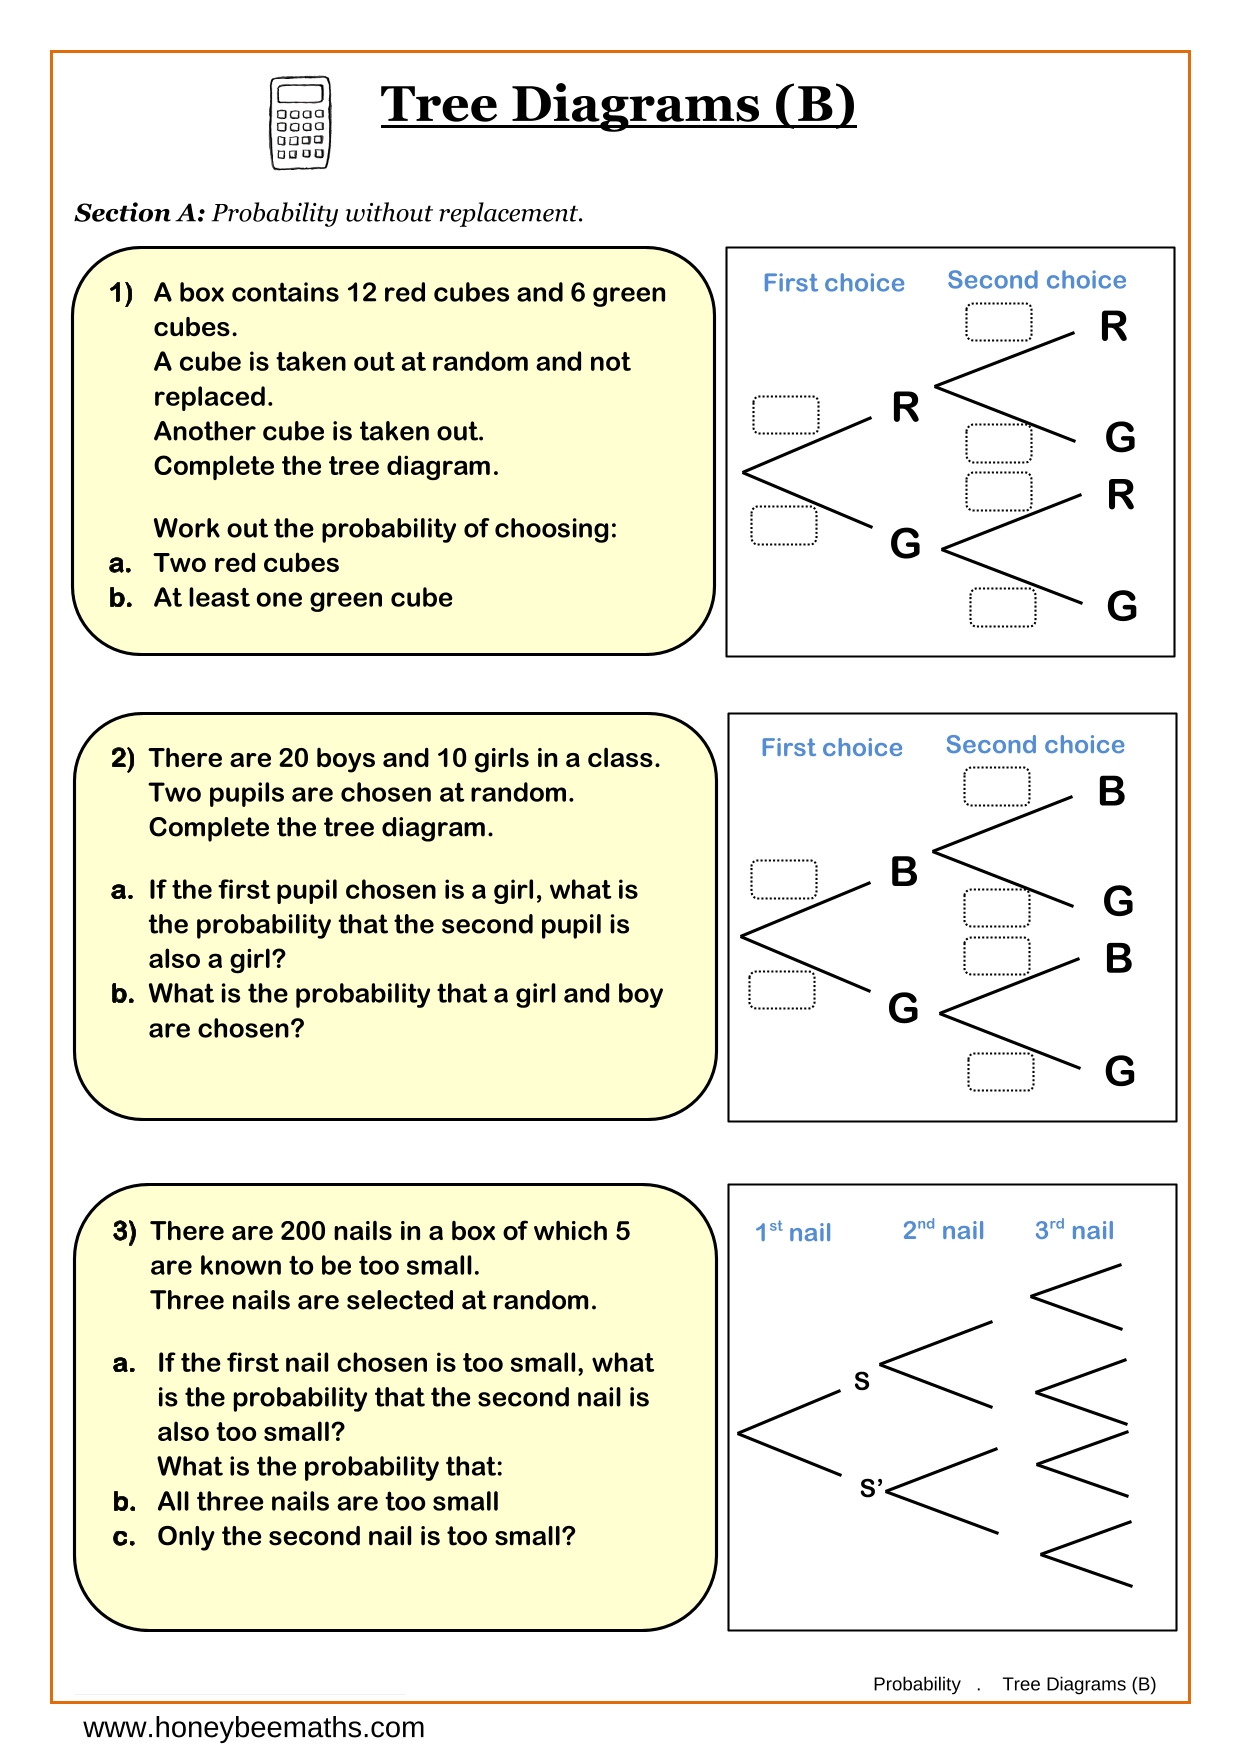
For more Probability Worksheets, see Year 8 Probability Worksheets
Common Questions about Year 9 Probability
What is relative frequency?
Relative frequency is an estimate of probability found by dividing the number of successful outcomes by the total number of trials.Why are sample space diagrams useful?
Sample space diagrams help organise all possible outcomes and make probabilities easier to calculate.How can a tree diagram be used to find probabilities?
Multiply probabilities along branches and add probabilities from different successful outcomes when required.
Year 9 Probability Common Mistakes
Common Mistake 1
Forgetting to divide by the total number of trials when calculating relative frequency.Common Mistake 2
Missing possible outcomes when completing a sample space diagram.Common Mistake 3
Adding probabilities along branches instead of multiplying them in a tree diagram.
Probability Worksheets - Free Worksheets Above

Relative Frequency

Sample Space Diagrams

Tree Diagrams (A)